Saturday, January 31, 2015

PIVOT LEVELS

Pivot Points are sub-set of Support and Resistance. This special form of projected Support and Resistance from base trading methodology used be the local traders on the floor of the exchange.

Pivot Points are calculated Price Levels that the floor traders, and those who read the tape, like to watch during the trading session.
Candlesticks - Harami


Harami

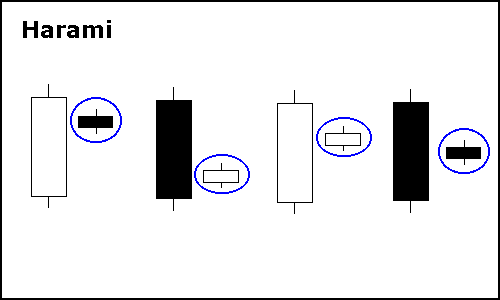
The harami is comprised of a long real body and a small real body withinnnits range. The harami is the reverse of an engulfing line. Whereas in an engulfing pattern there is a long candle engulfing the previous real body, a harami is an unusually long real body followed by a very small real body. A harami, after an advance shows that the market must have failed to maintain higher prices.

Candlesticks - The Engulfing


The Engulfing Patterns


A bullish engulfing pattern is formed when, during a downtrend white real body wraps around a black real body. A bearish engulfing pattern is completed when, during a rally, a black real body envelops a white real body.

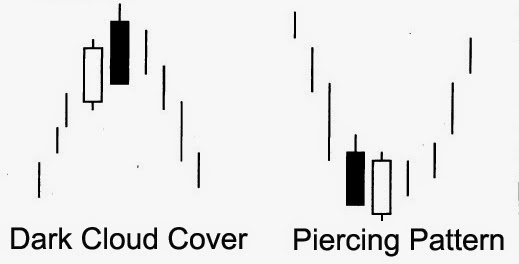
The engulfing pattern visually shows how the opposing forces had gained control of the market. For example, a bullish engulfing pattern reflects how the bulls have wrested control of the market from the bears. A bearish engulfing pattern shows how a superior force of supply has overwhelmed the bulls. This means that the bearish engulfing pattern is more bearish than a dark cloud cover, and a bullish engulfing pattern more bullish than a piercing pattern, it is equally important to see where these patterns emerge before deciding which is more important. For instance, a piercing pattern that confirms a major support area should be viewed more likely as a bottom reversal signal than a bullish engulfing pattern that does not confirm support.

Candlesticks - Doji


Doji

Doji session has a horizontal line instead of a real body. This is because a doji is formed when the session's open and close are the same price (or almost the same). In essence the doji is echoing, on a micro scale, the indecision reflected on a more macro scale by the market's sideways action. However, a doji that emerges after the mature part of an uptrend or sell-off has a greater chance of a market turn.

Candlesticks - Spinning Tops


Spinning Tops

Small real bodies, which would tell us that the bulls and bears are in a tug of war and that there is more of a balance between supply and demand. Spinning tops, tell us that the power to move up or down is lacking, or as the ]apanese phrase it, the "market is losing its breath." Real body can be black or white.

Candlesticks - Dark Cloud Cover and The Piercing pattern


Dark Cloud Cover

A dark cloud shows, as the Japanese express it, that the market has a poor chance of rising. The dark cloud cover's first candle is a strong white session. During the next session, there is buying pressure left over and the market opens higher, but later in that session, prices decline as the market closes under the center of the previous session. This pattern reflects a period in the market when the upward power of the tall white candle has been dissipated by next session's weak black candle. In other words, the dark cloud cover displays pictorially a time in the market in which selling pressure is exceeding the buying pressure. A dark cloud cover often becomes resistance.

Candlesticks - Shooting Star


The Shooting Star

A session with a long upper shadow and a small real body near the bottom end of the trading range is called a shootings tar. Just as the long lower shadow of a hammer is bullish, so the long upper shadow of the shooting star is bearish. The long upper shadow means that the bears have been able to sharply drag prices back from their highs. Shooting star must appear after an uptrend. The shooting star's long upper shadow reflects market rejection of higher prices.

Candlesticks - Hammer and The Hanging Man


Hammer

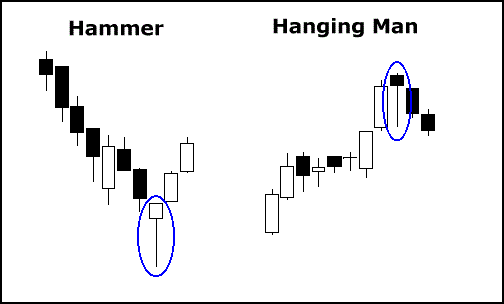
The hammer, with its long lower shadow and a close near or at the high, is easily understood to be a bullish signal. The term "hammer" derives from the fact that the market is "hammering out a base," or that a bottom is so solid that it does not break, even when a hammer knocks away at it.

An aspect of the hammer is that it must appear after a significant downturn or in an oversold market to have significance. The hammer is a reversal indicator, and as such, should have a downtrend to reverse.

Since the hammer is most useful after a significant downturn, it should be noted that there may be selling on a rally from the
hammer. As such, the first bounce from the hammer may fail and the market may return to test the hammer's support.

Friday, January 30, 2015

Classic Pattern - Ascending Triangles and Descending Triangles

Ascending Triangles

Ascending Triangles form when prices attempt to make higher highs and lower lows suggesting a bullish price trend. The Ascending triangle is bound by two trendlines: a horizontal line at the top and an upward slope trend line connecting the lower lows. Ascending triangles"form in any market and are quite reliable. The Triangle prices must intersect the trend lines at least twice (each) before the pattern is complete. Usually at the third or fourth attempt to trade outside the top trend line results in a breakout. Breakouts occur near the apex of the triangle.

Classic Pattern - Symmetric Triangle


Symmetric Triangles form when the markets are in indecision mode. The Symmetric triangles can be easily detected when prices make alternate "lower highs" and "higher lows" in upside and downside slopes defining a symmetry. Symmetric triangles form when supply and demand are near equal resulting in market indecision. Most triangles result in a clear breakout and breakdown in the direction of the prior trend.


Classic Pattern - Pennant Pattern


A continuation pattern formed when there is a large movement in price, the flagpole, followed by a consolidation period with converging trendlines, the pennant, followed by a breakout movement in the same direction as the initial large movement, the second half of the flagpole. Pennants, which are similar to flags in terms of structure, have converging trendlines. A clear breakout confirmation is needed to trade these patterns as the price continues in the same direction prior to the pennant formation.

Classic Pattern - Head and Shoulders


Head and Shoulders patterns are reversal formations that usually form at the market tops. Head and Shoulders patterns are very reliable, but failures do occur. When Head and Shoulders patterns fail, they reverse the pattern and trade in an explosive manner. A trend line or neckline is drawn connecting the Head and Shoulders pattern to determine the potential trade opportunities and targets. The neckline can be also formed in an angle (slanted).

Classic Pattern - Bull and Bear Flag


Bear Flag

"Bear Flags" usually occur as markets fall from a base and pause in a downtrend. They are almost identical to "Bull flags," but in the opposite direction. "Bear flags" can be easily spotted as they make "higher highs" and "higher lows" within the "flag" area. The trend lines connecting "highs" and "lows" are almost parallel. A clear breakdown confirmation is needed to trade these patterns as the price continues in the same direction prior to the "flag" formation. Like "Bull flags," "Bear flags" are also very reliable.